Using satellite remote sensing and cloud-based unsupervised machine learning, hydrosolutions GmbH has implemented a fully automatic mapping procedure for the global drylands that allows to identify irrigated land, crops and water consumption with a web app at the tip of a finger at any place of your choice.
Classification accuracy
Validation pixels
Resolution of output maps
Mapped irrigated area in Inner Asia
The Importance of Irrigation Monitoring
Sound water resources planning and management require adequate data with sufficient spatial and temporal resolution. This is especially true for the irrigation sector, the primary consumptive user of the world's freshwater resources. While ground-based data on irrigated land acreages are scarce and often unreliable, the adoption of remote sensing technology in the planning and management of irrigated agricultural systems has never been fully operational in the development context. The reason for this is high costs, the need for skilled workers, and remote sensing methods that usually only work in one place and time. Recent developments in cloud computing with services available such as Google Earth Engine (GEE) can help to overcome some of these constraints.
Irrigation & Change Mapping
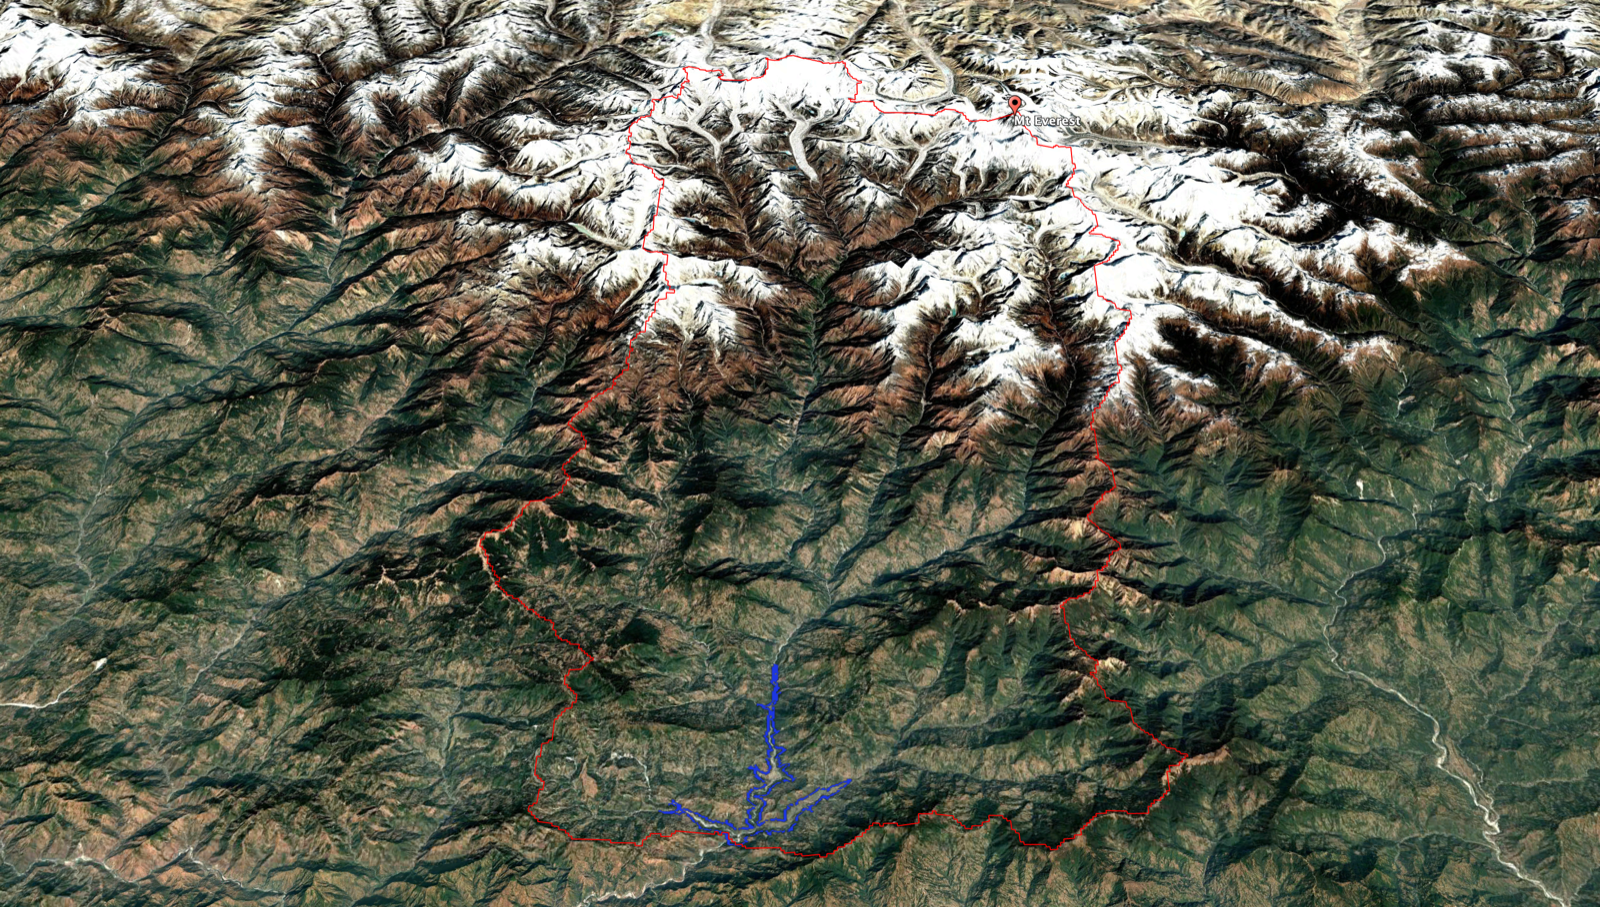
hydrosolutions Ltd. has implemented a fully automatic irrigation mapping procedure in GEE that uses surface reflectance satellite imagery from different sensors. Ground-based data are not required. The method is based on the unsupervised clustering of image pixels within training areas identified through object-based segmentation. The clustering technique distinguishes productive irrigated fields from non-productive and non-irrigated regions monthly. A number of automatized post-processing steps are then carried out, making use of multi-temporal data to improve the classification accuracy and produce final monthly and annual irrigation maps (30 m resolution). The novel method is applied to Inner Asia, including Afghanistan, Central Asia, and Western China, where we have calculated the development of irrigated areas from 2000 to 2017. The classification results are assessed in terms of robustness and accuracy. Based on six available testing scenes (in total 700'000 pixels), the classification accuracy is 77% - 93%.
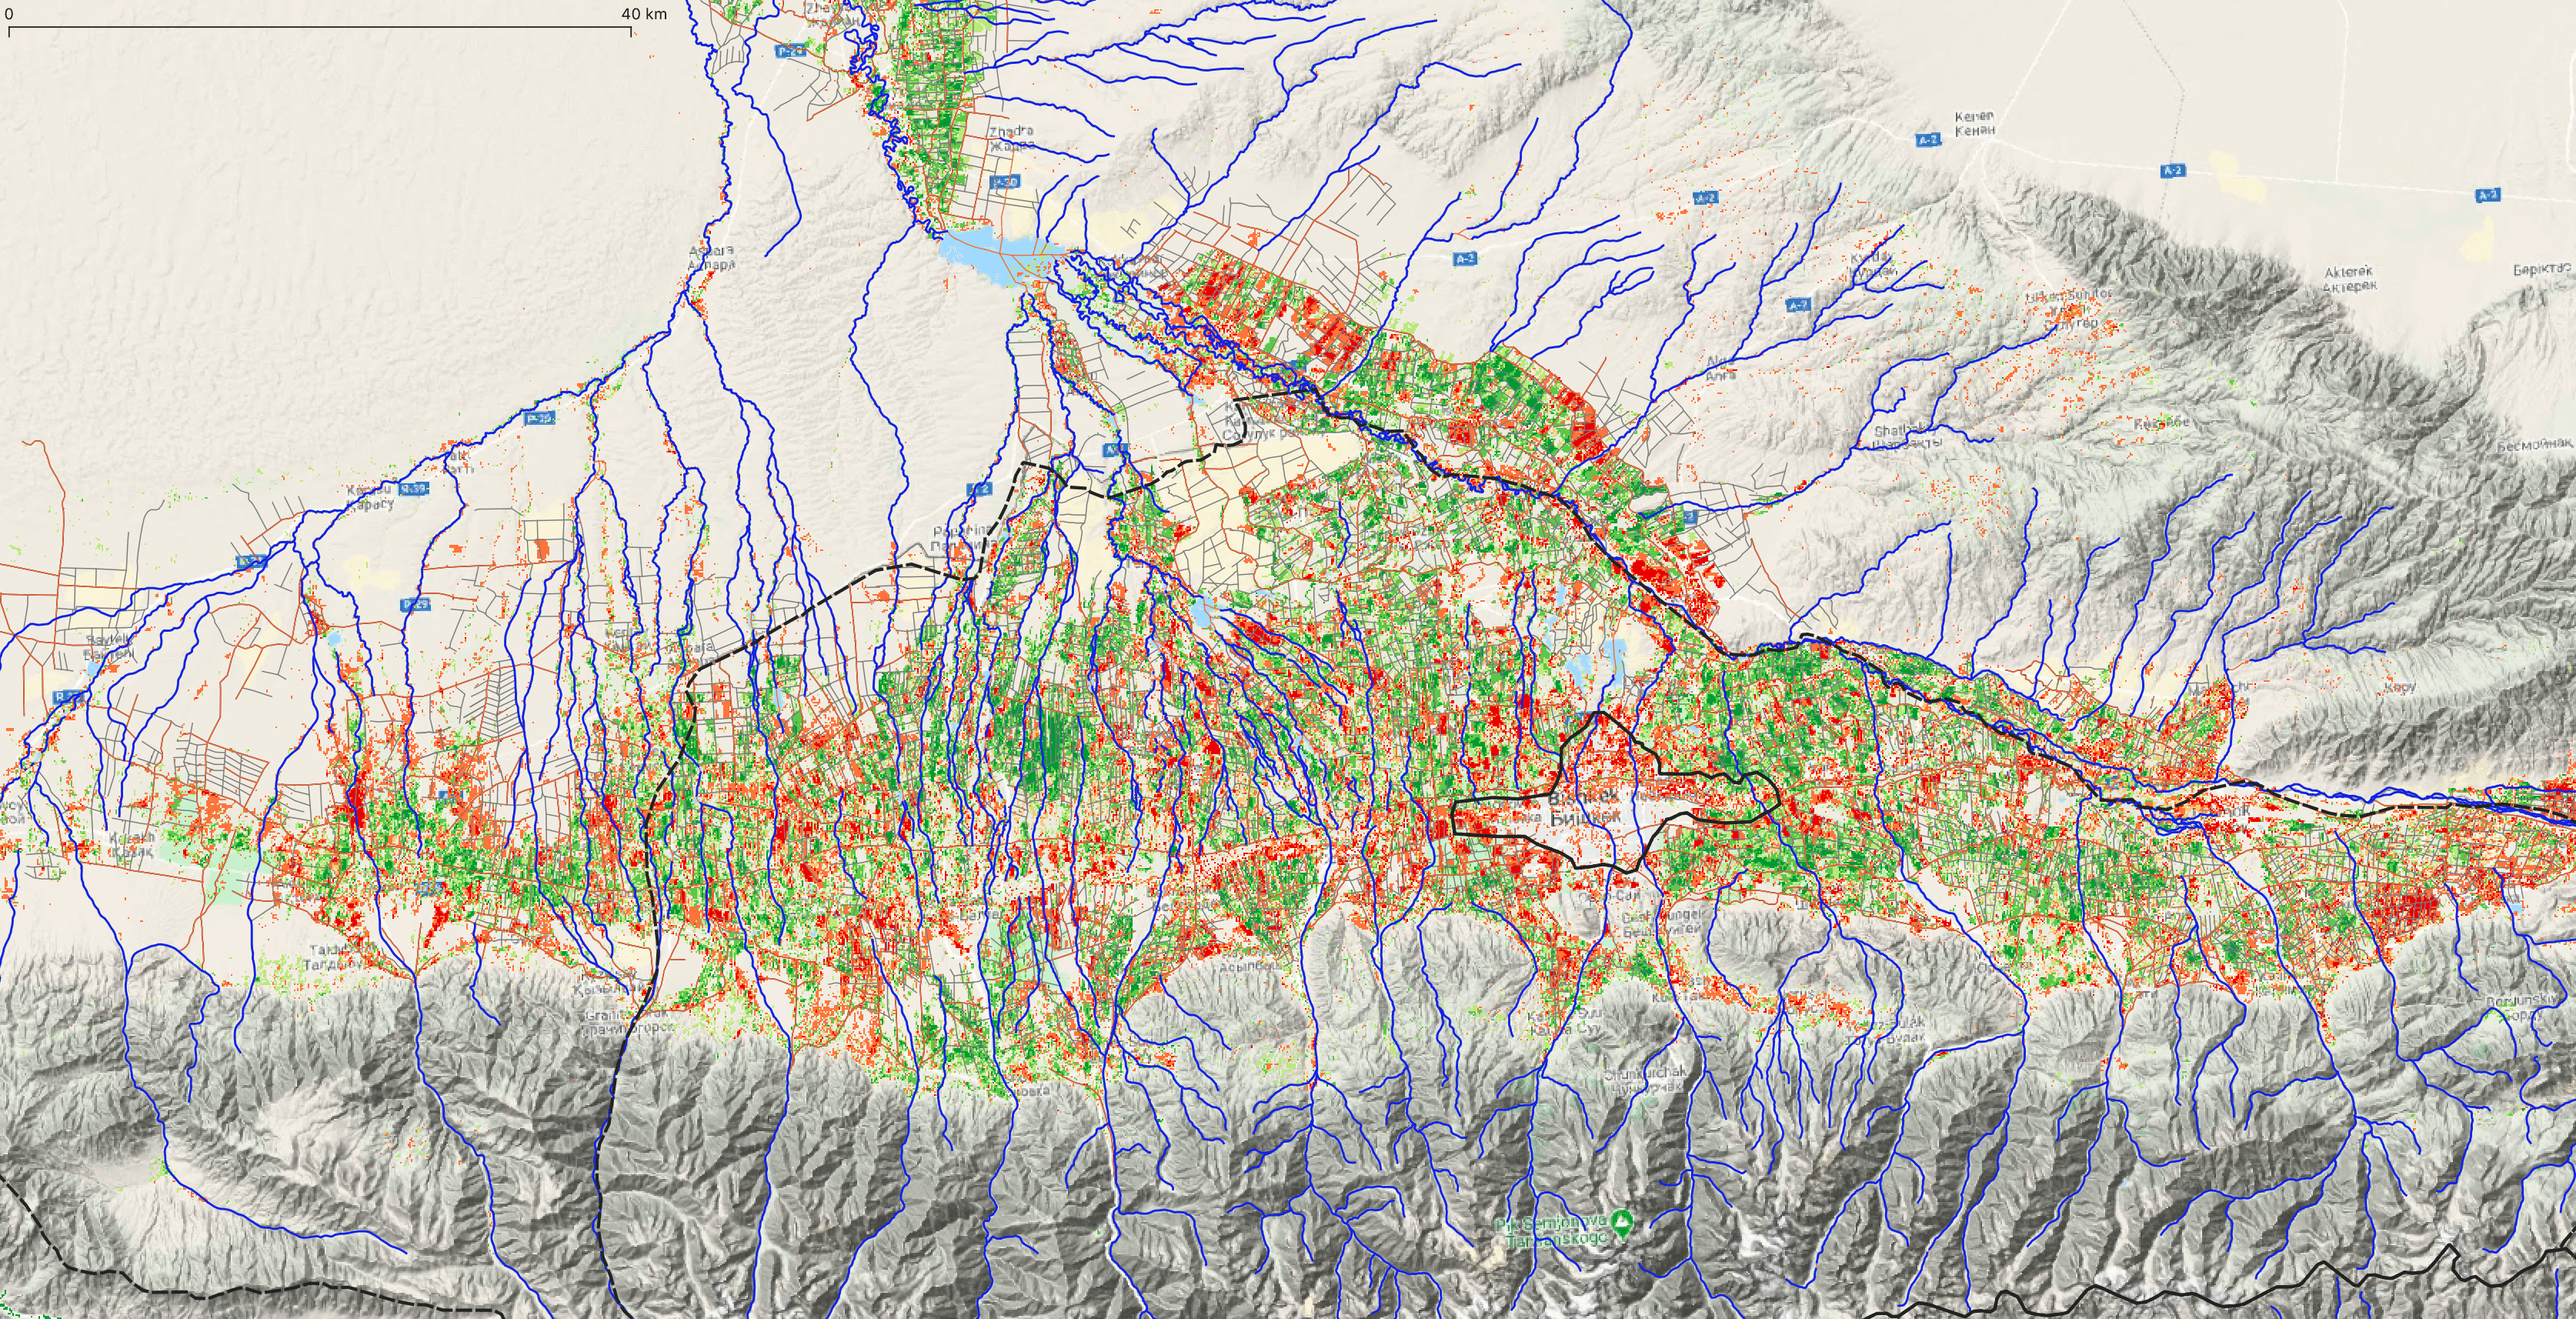
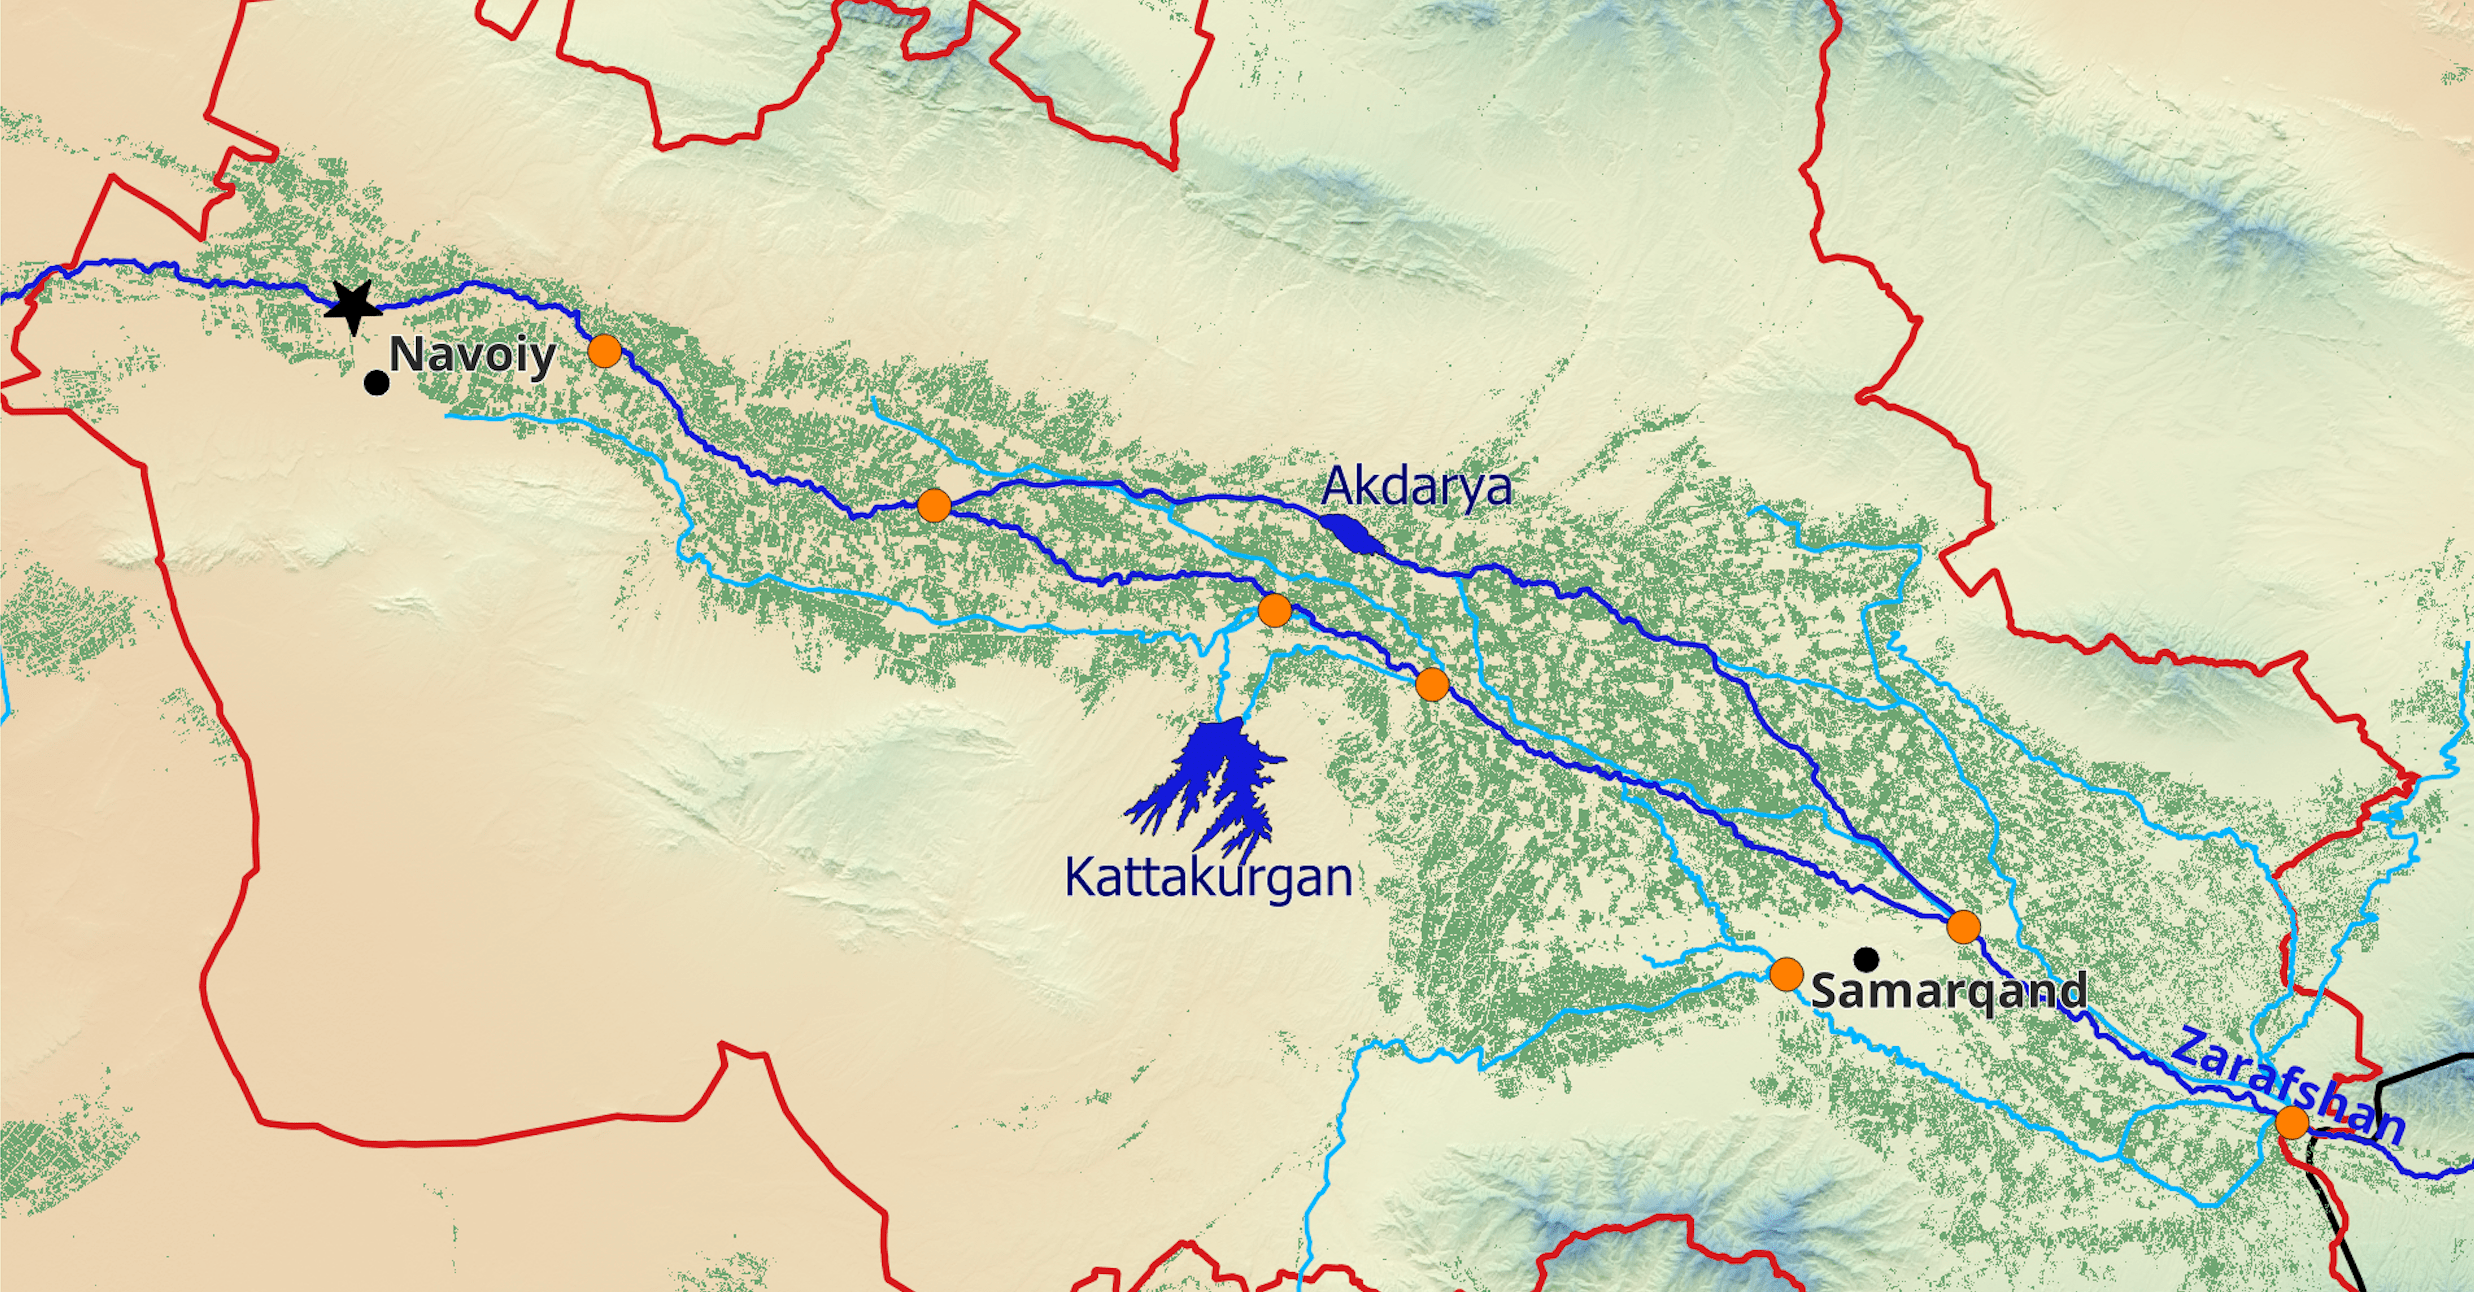
For the Central Asian Chu and Talas River Basins that are shared between upstream Kyrgyzstan and downstream Kazakhstan, we have deployed a monitoring tool that allows us to map irrigated areas and, based on these data, compute irrigation scheme efficiencies. Results show that on the Kyrgyz side of the Talas basin, derived increasing trends over the years are highly significant (23% area increase between 2000 and 2017). In the Chu Basin, we identify significant correlations between in-season precipitation and annual irrigated areas, reflecting on how agricultural production is limited by access to scarce water resources. We show how the multi-temporal, high-resolution irrigation maps derived in this study can help local stakeholders study the performance of vast and complex irrigation systems and monitor irrigation activities, from field scales up to transboundary levels. The tool can also be used to monitor canal catchment level development of irrigated areas. This allows authorities to readily obtain essential indicators of the performance of the large irrigation systems in the region.
Crop Type Mapping
Crop type mapping at the field level is necessary for a variety of applications in agricultural monitoring and water resources management. Remote sensing imagery is a powerful input from which crop type maps can be created. hydrosolutions GmbH is currently designing various apps that facilitate users with no or minimal background in remote sensing to access and use such data for their purposes. Here we present a new browser application that we have designed to generate high-resolution annual maps of crop types and cropping patterns in different irrigation systems in the global drylands.
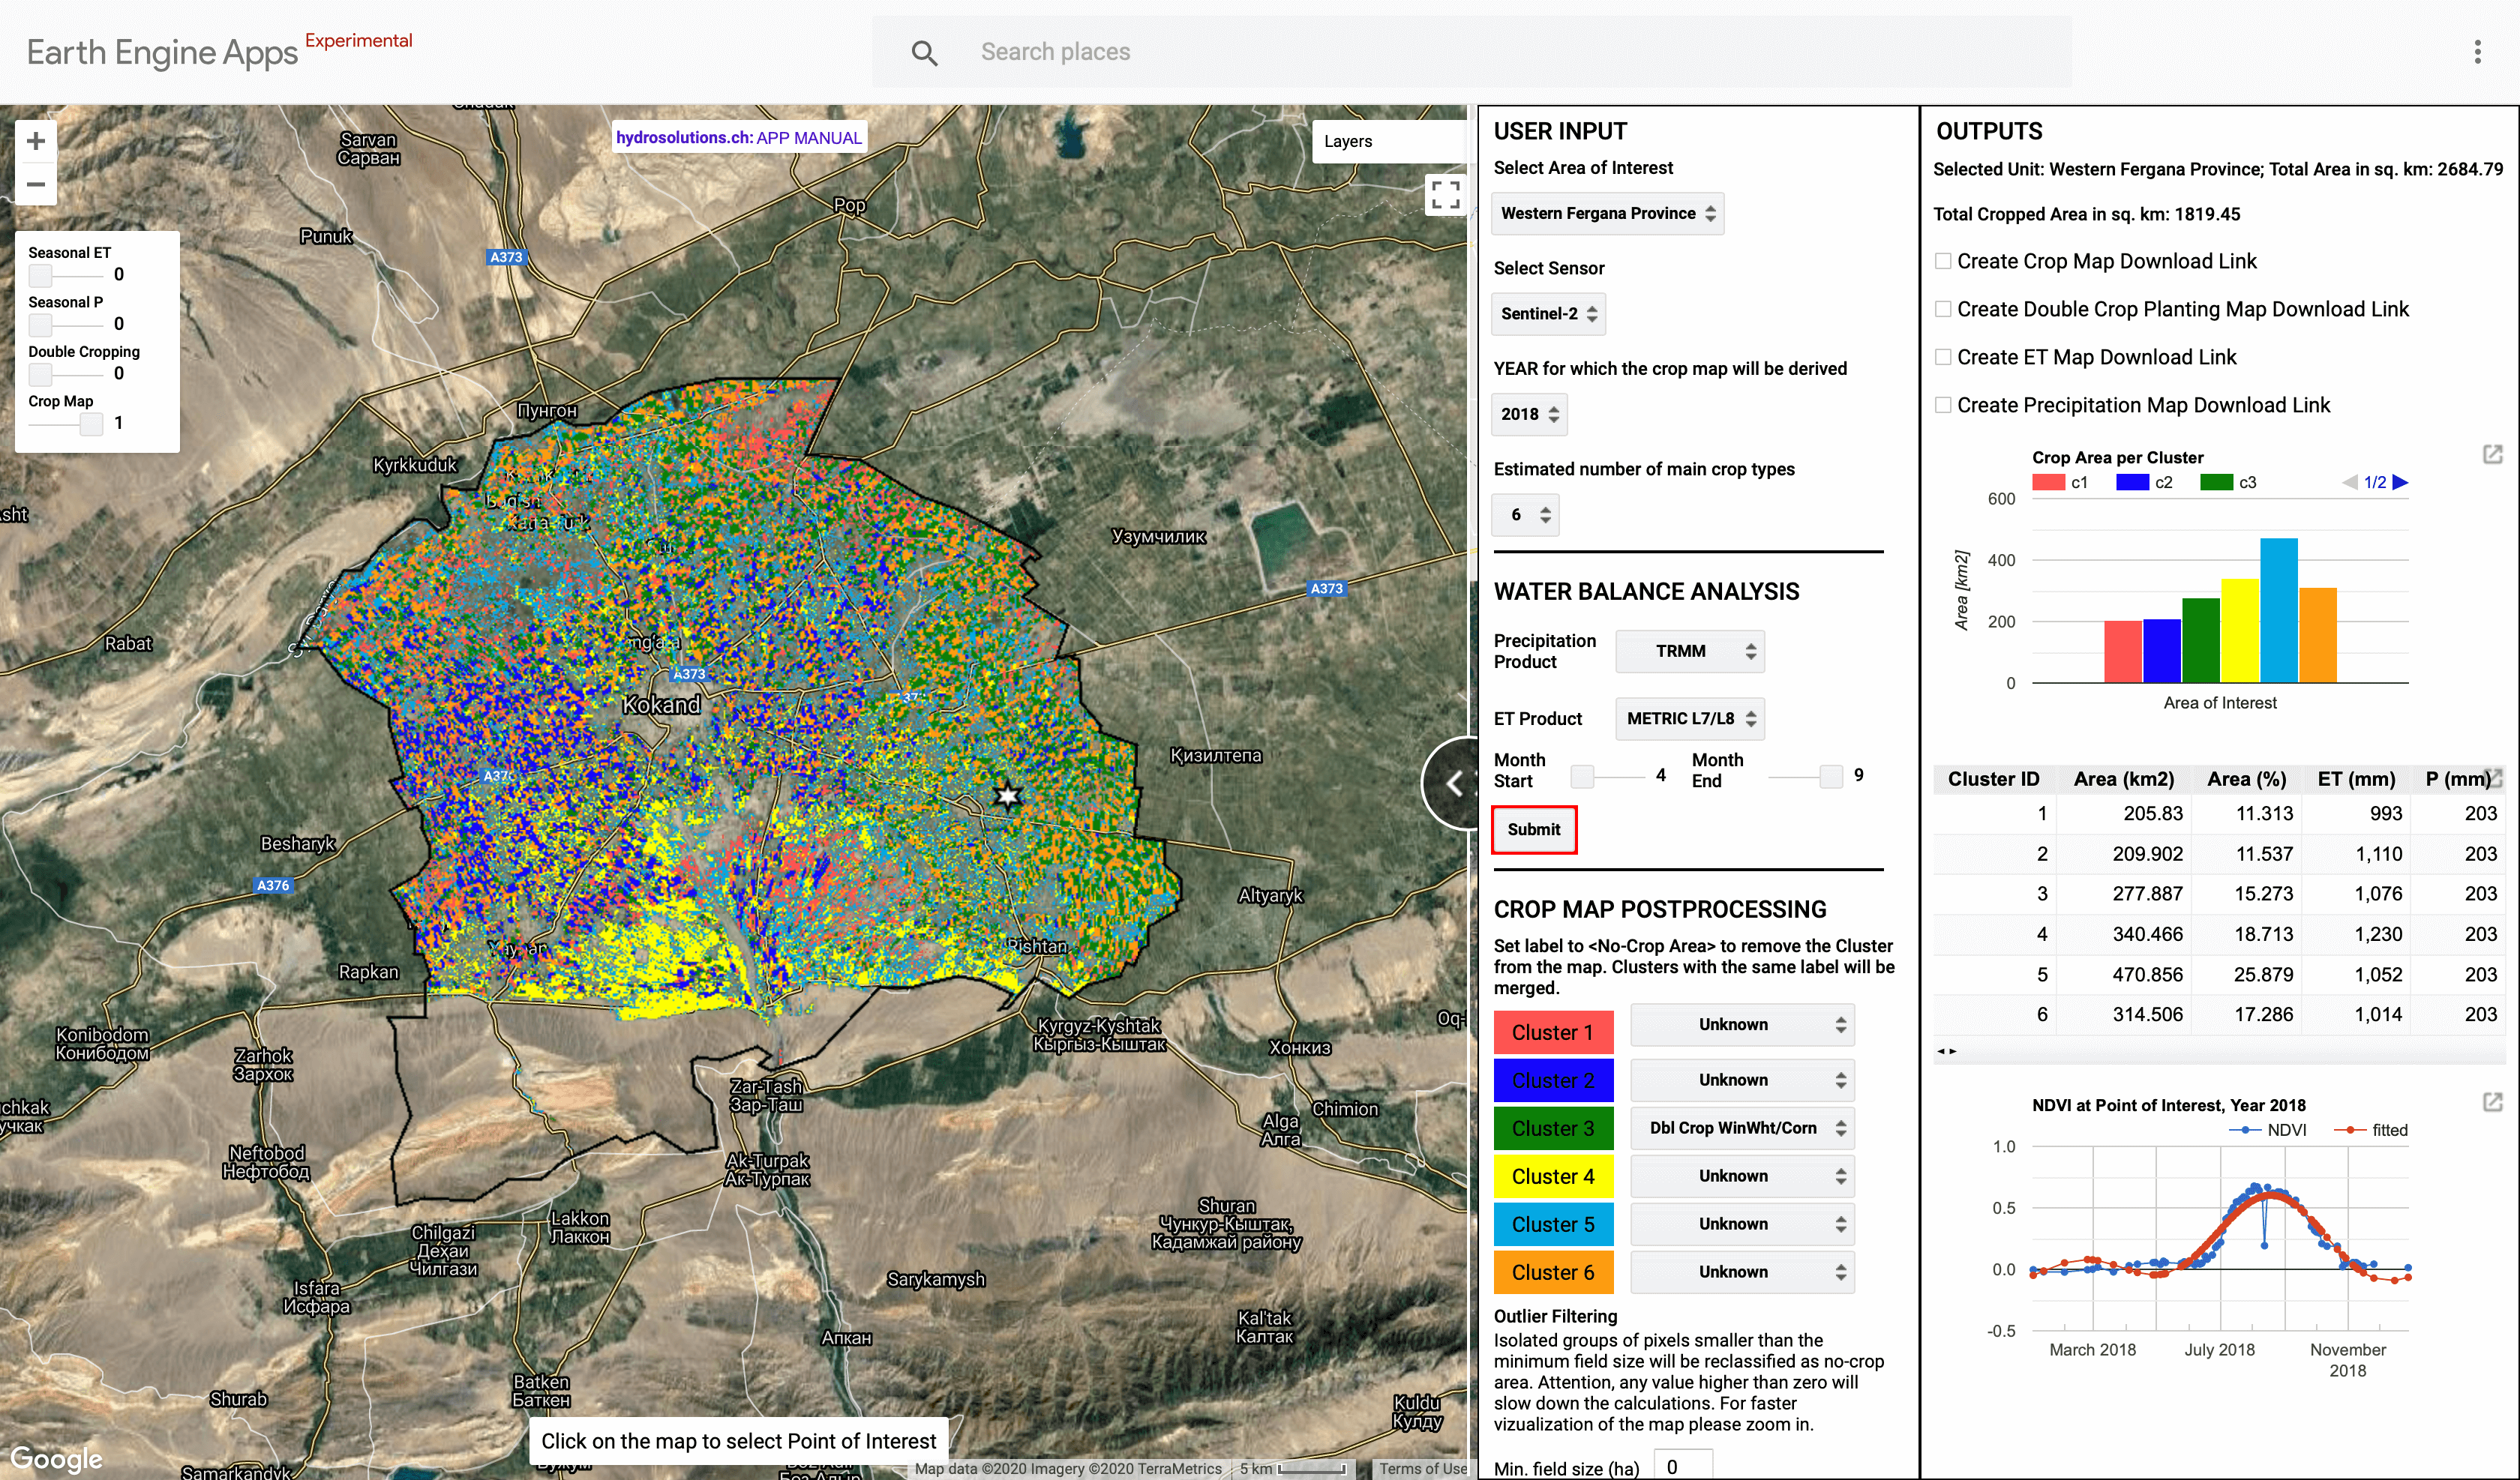
The methodology for crop type mapping that we have implemented in our tool is based on an unsupervised classification technique proposed and evaluated by Wang et al. 2019. It uses harmonic regression in Google Earth Engine to extract features from time series of optical remote sensing data. The features are then used to cluster the pixels, i.e. to group pixels with similar features into different classes. The final step is to label the classes, which means that we must attribute a crop type to every cluster of pixels. This last step is not automatized, and we rely on the expert knowledge of the local users to label the clusters with the main crop types that are growing in his region of interest. To facilitate this task, users can display the characteristic time series of vegetation indices, or they can identify the crop type by looking at the provided high-resolution satellite imagery. The advantage of our method is that it is not constrained by the common lack of field-level crop labels for training and can therefore theoretically be applied anywhere on the planet where optical satellite imagery is available. Clouds and haze are the methods’ main adversaries, and it works best in arid or semi-arid regions with distinct seasons and crop growth calendars.
More information and access to a sample application for crop type mapping in different areas of interest can be obtained on the dedicated application site.